Cybersecurity is a constant battle fought across borders, industries, and networks.
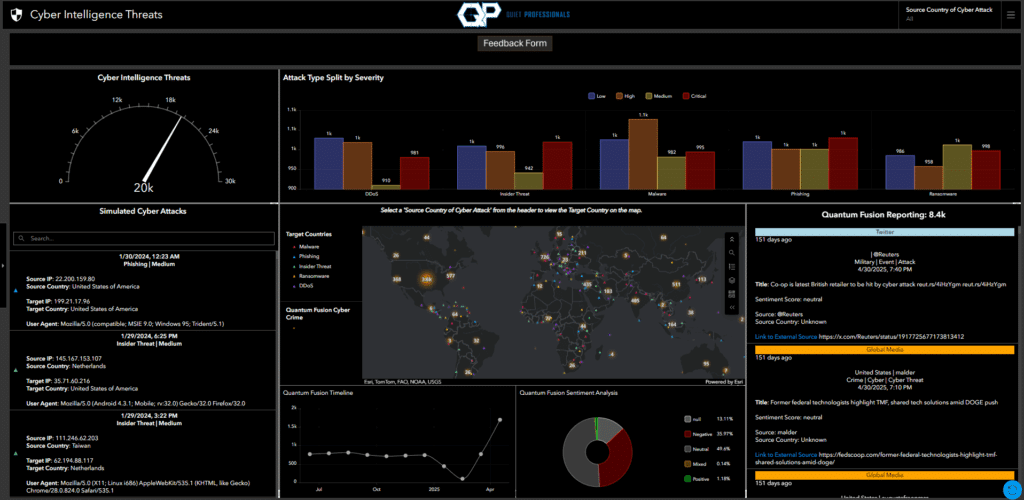
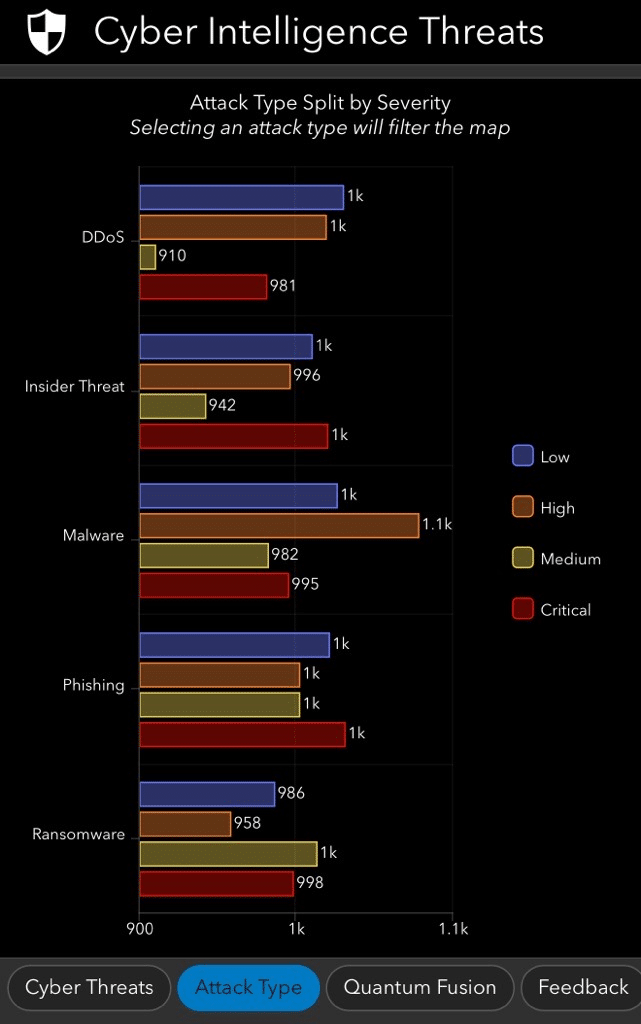
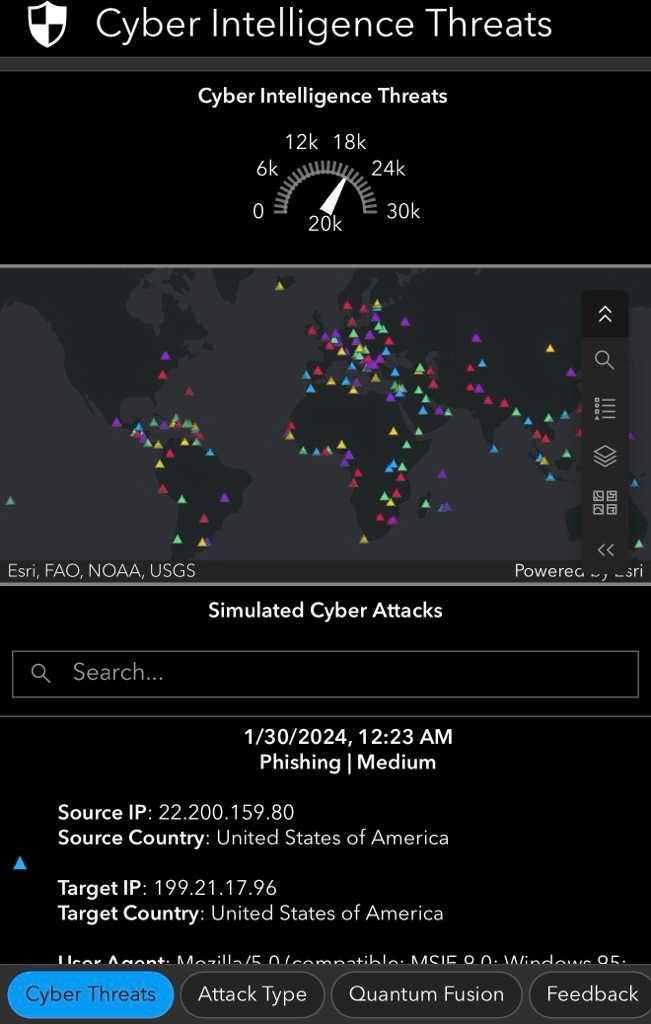
To truly understand the scope of these threats, it’s essential to have tools that provide a clear picture of where attacks are happening and what types of attacks are being executed. This month’s public dashboard in our series offers an interactive exploratory data platform that allows viewers to dive into the global distribution of cyberattacks.

An Overview of the Cyber Intelligence Dashboard
This dashboard focuses on target countries for various cyberattacks, offering a global perspective on the impact of these threats. The data spans a four-year period, from December 31, 2019, to January 30, 2024, providing insights into historical cyber activity during this timeframe. It also integrates data sourced through Signals OSINT, a real-time data-fusion engine that synthesizes structured and unstructured information from diverse sources, including IoT sensors, and social media. Signals OSINT enriches the user experience by pulling and presenting relevant news and current reports about cyber incidents. This gives analysts access to real-time context, including links to source articles and sentiment analysis, enabling them to quickly assess and understand ongoing events.

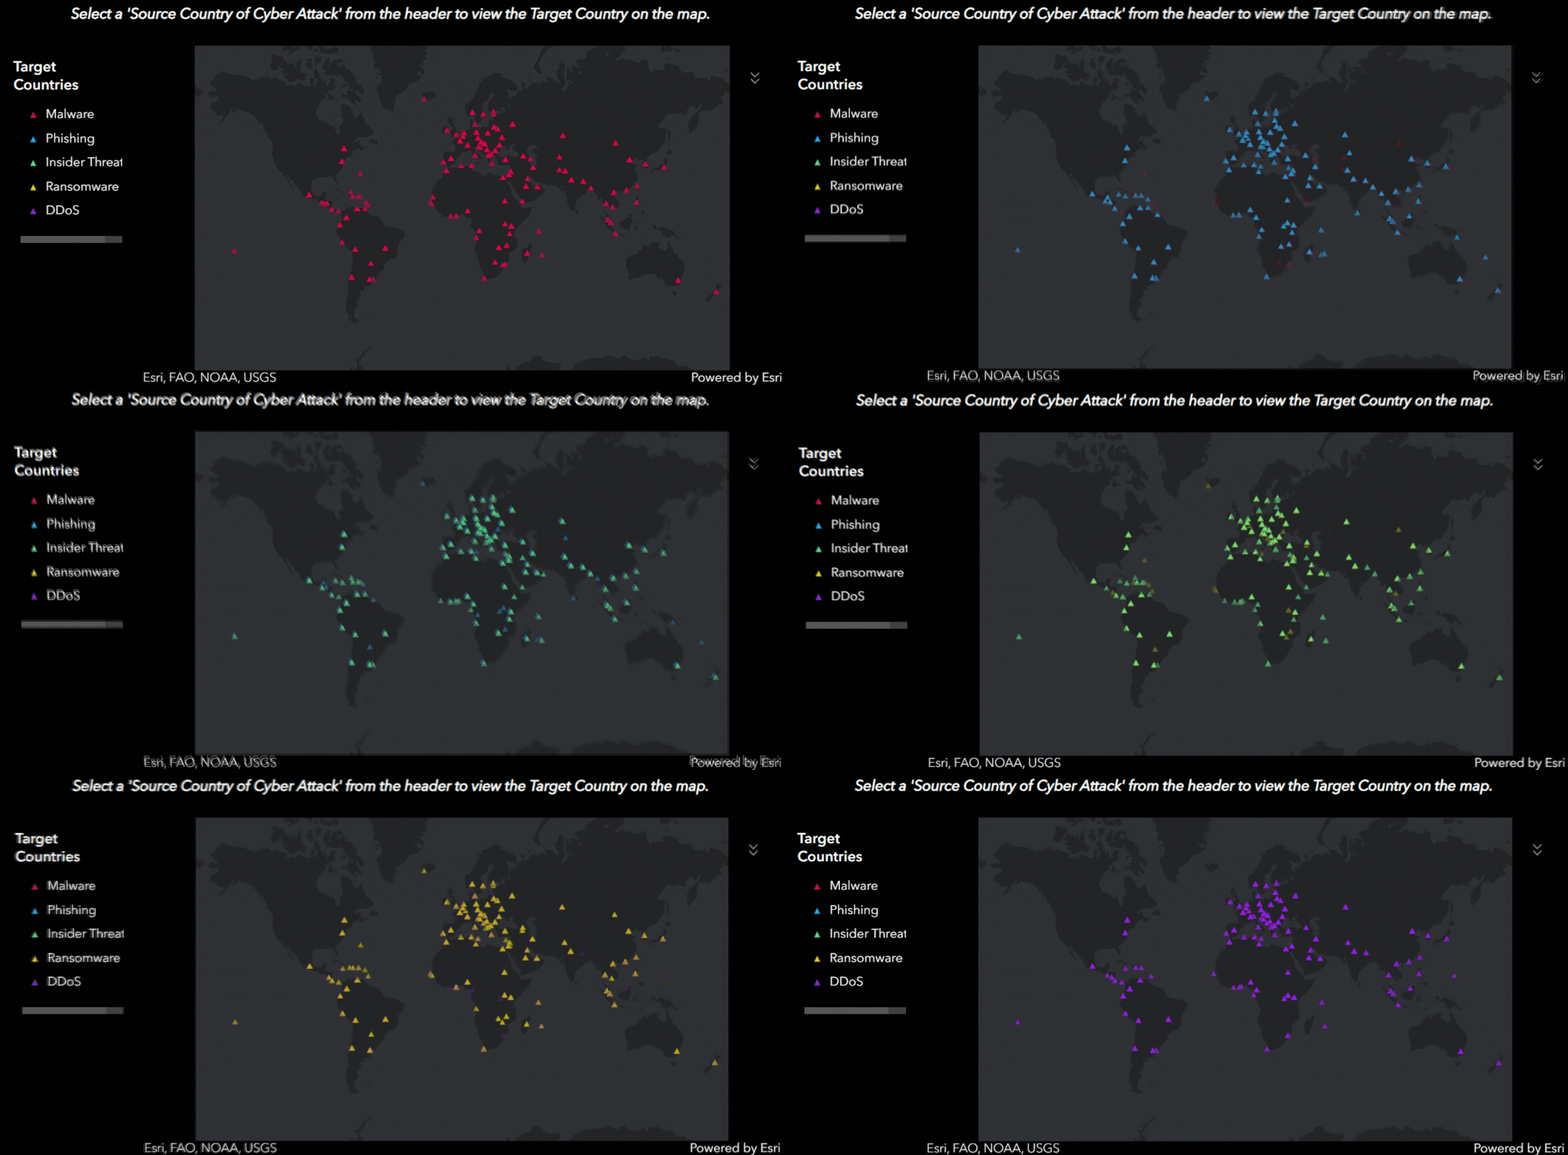
With interactive features, viewers can visualize which countries have been targeted by specific types of common attacks, including:
- DDoS (Distributed Denial of Service): Overwhelming a server, service, or network with traffic to disrupt operations.
- Insider Threats: Risks posed by individuals within an organization, whether intentional or accidental.
- Malware: Software intentionally designed to cause damage, disrupt operations, or gain unauthorized access.
- Phishing: Attempts to trick individuals into revealing sensitive information, such as login credentials or financial data.
- Ransomware: Malicious software that encrypts files, holding them hostage until a ransom is paid.
Each attack type is mapped out across the globe, offering a broad overview of the countries targeted. This interactive tool is publicly accessible, encouraging users to explore the data and uncover insights on their own.

Real-Time Contextual Insights
Signals OSINT enhances the dashboard’s capabilities by pulling current news and reports related to cyber incidents from a wide range of sources. These reports can include key details such as the incident type, affected organizations, and sentiment analysis, providing analysts with the information they need to act quickly. This approach saves time by consolidating relevant updates in one place, removing the need to manually sift through countless news sources.
Mapping Cyber Threats
This dashboard offers a broad overview of global cyberattacks, providing valuable insights for anyone seeking to:
- Identify high-risk regions for specific attack types.
- Understand which countries are frequently targeted.
- Consider how these patterns align with organizational risk or threat models.
Imagine the Possibilities with Enhanced Data
While this dashboard leverages publicly available data, consider the potential of integrating private or proprietary datasets. Incorporating additional data could unlock deeper, more targeted insights like:
- Industry-Specific Analysis: Understanding how cyber threats impact sectors like healthcare, finance, or manufacturing.
- Time-Based Trends: Tracking how attack frequencies evolve over time.
- Enhanced Threat Correlation: Linking target countries with originating sources to understand the broader threat landscape.
For example: By incorporating private datasets, organizations could pinpoint not only where phishing attacks are most prevalent but also the demographics or industries most targeted within those areas.
Practical Applications for Users
This dashboard serves as a useful tool for various professionals, such as
- Cybersecurity Analysts: Quickly assess global risk hotspots and align them with internal threat models.
- Incident Response Teams: Understand which types of attacks are most likely to affect operations in specific regions.
- Policy Makers and Researchers: Leverage real-world data to craft informed cybersecurity strategies.
A Gateway to Deeper Insights
This interactive dashboard offers a unique opportunity to explore the global distribution of cyberattacks. By integrating real-time data and geographical mapping, it provides an essential tool for understanding the scope of today’s threats. While it currently focuses on publicly available information, the possibilities expand significantly when considering private or proprietary datasets.
Whether you’re a cybersecurity professional, a policymaker, or simply someone curious about the global nature of cyber threats, this dashboard invites you to engage with the data, ask questions, and imagine what’s possible.
Dashboard Screenshots

