While hurricane season officially begins in June, it’s August through October that bring the real action, and the greatest risk. Historically, this stretch produces the majority of named storms, hurricane landfalls, and storm-related impacts in the U.S.
According to NOAA, over 90% of U.S. hurricane landfalls occur between August and October. That’s because several key factors come together this time of year:
- Sea surface temperatures are at their warmest, fueling storm development.
- Wind shear weakens, allowing tropical systems to organize and grow.
- Moisture increases across the Atlantic, and tropical waves from Africa become more defined, offering the perfect conditions for new storms to form.
Recent years back this up: storms like Idalia, Ian, Milton, and Helene all struck during this high-risk window. That’s why it’s important to stay aware and informed as the season ramps up.
In this edition of Project Cognizance, we’re highlighting two tools powered by Signals, Quiet Professionals’ situational awareness suite, built to help anticipate and respond to storm threats. One looking back, and one looking ahead.
The Hurricane Milton Flood Report

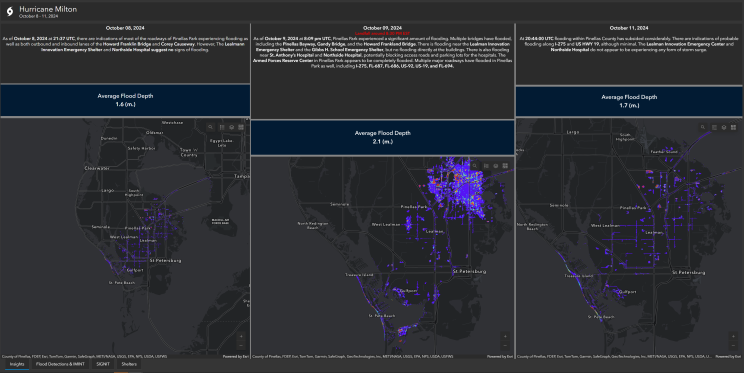
When Hurricane Milton made landfall near Siesta Key on October 9, 2024, it brought 120 mph winds and widespread flooding across Pinellas County. Some areas saw water depths over four meters, disrupting roads, bridges, and emergency access.
This Signals GIS dashboard report shows how conditions unfolded from October 8–11 using satellite imagery and flood depth analytics. Key impacts included:
- Closures on the Howard Frankland, Gandy, and Pinellas Bayway
- Flooding near hospitals and emergency shelters
- Widespread road closures in Pinellas Park
It’s a resource for after-action review and future planning, built to help decision-makers identify risks and improve response strategies.
The Severe Weather Tracker

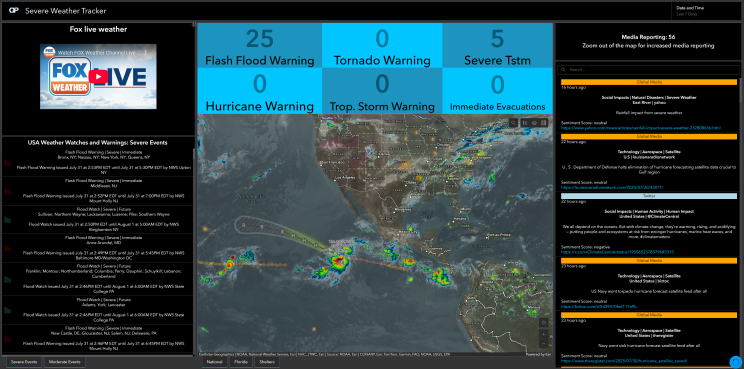
While the Milton dashboard looks back, our Severe Weather Tracker is built to monitor what’s happening right now.
Updated daily, this tool brings together flood alerts, rainfall data, and severe storm advisories from across the U.S., all in one place. It’s designed to make it easier to spot high-risk areas quickly, without jumping between sources.
Whether you’re tracking conditions near home or keeping an eye on broader trends, the dashboard gives a clear view of evolving weather threats. With peak hurricane season underway, it’s a practical way to stay informed and ready.